


")

Educational
Effectiveness
2024-2025 Educational Effectiveness At
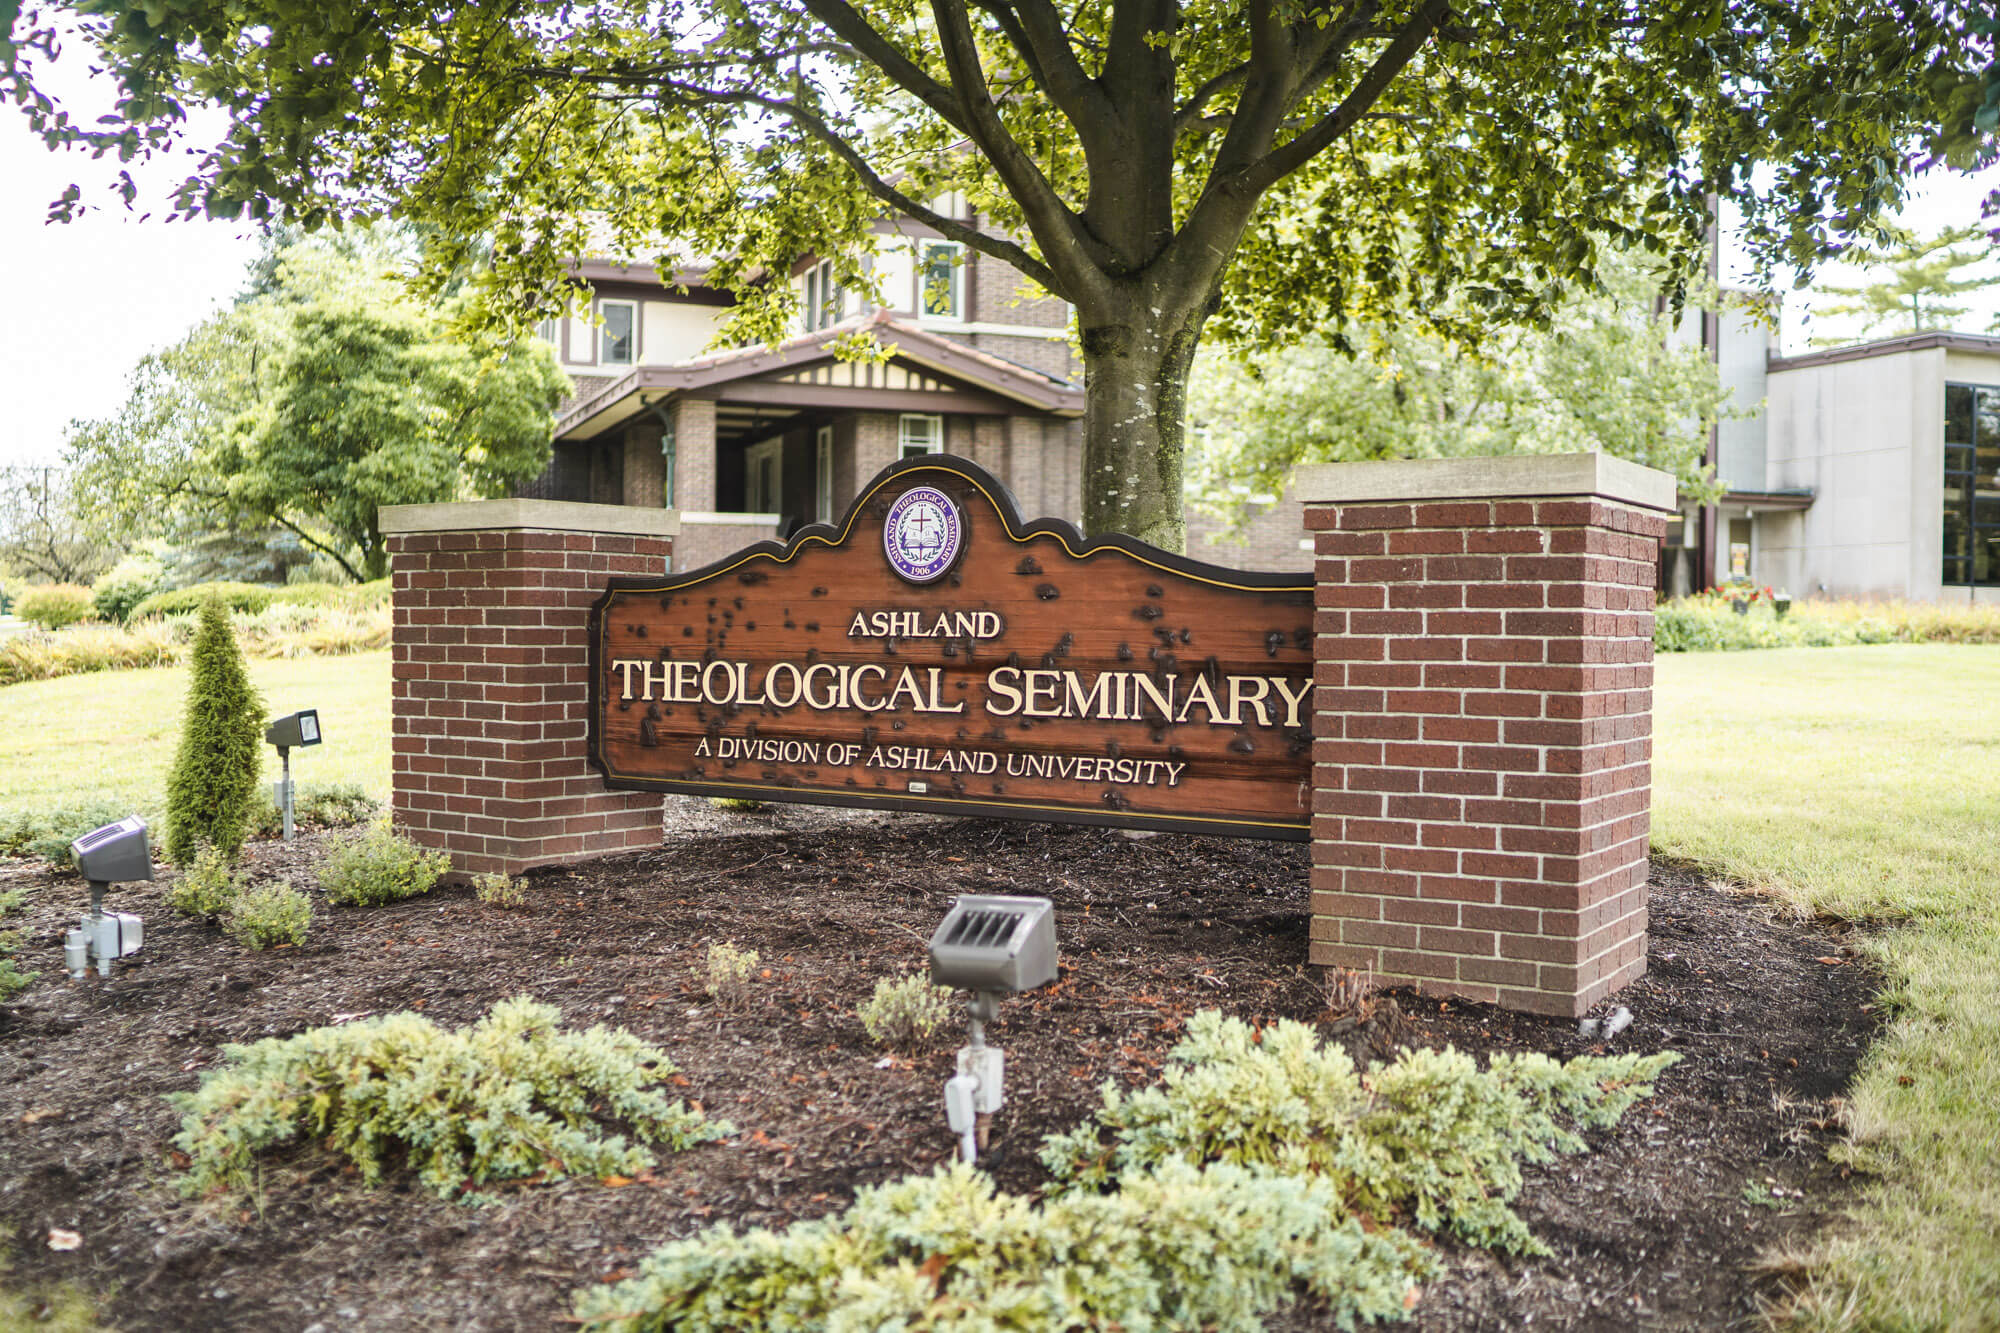
Ashland Theological Seminary
Ashland Theological Seminary integrates theological education with Christ-centered transformation as it equips men and women for ministry in the church and the world. Educational effectiveness is one way the Seminary gives public account of how this mission is being lived out across its degree programs through student learning, formation, and preparation for vocational service.
In alignment with the standards of the Association of Theological Schools, Ashland Seminary makes information related to educational effectiveness publicly available as part of its commitment to institutional integrity, transparency, and continuous improvement. The data presented on this page reflect multiple forms of evidence used by the Seminary to assess educational outcomes in light of its mission and context. This information is reviewed and updated annually at the conclusion of the summer term.
Entering Student Questionnaire Fall 2024
ESQ. Table 18. Importance of Factors in Decision to Pursue Theological Education
| ESQ. Table 18. Importance of Factors in Decision to Pursue Theological Education | % |
|---|---|
| 1. Opportunity for study & growth | 92% |
| 2. Experienced a call from God | 90% |
| 3. Desire to serve others | 90% |
| 4. Desire to make a difference in the world | 90% |
| 5. Intellectual interest in religious/theological questions | 84% |
Educational Effectiveness (2024-2025)
GSQ. Table 15. Educational Effectiveness in Facilitating Skill Areas:
Thirty-one graduating students rated 5 out of 20 skill areas at 4.3 or higher for Educational Effectiveness in Facilitating Skill Areas. This reflects strong achievement in core ministry competencies at Ashland Theological Seminary. All five of these areas exceed the standard benchmark of 4.0 (80%), indicating that students perceive ATS as highly effective in preparing them for ministry leadership.
| GSQ. Table 15. Educational Effectiveness in Facilitating Skill Areas | % |
|---|---|
| 1. Ability to work effectively with both women and men | 90% |
| 2. Ability to relate social issues to faith | 90% |
| 3. Ability to think theologically | 86% |
| 4. Ability to interact across cultural & racial/ethnic contexts | 86% |
| 5. Ability to work effectively within own religious tradition | 86% |
Measure of Educational Effectiveness and Personal Growth (2024-2025)
GSQ. Table 14. Measure of Educational Effectiveness and Personal Growth.
Thirty-one students Met and Exceeded in 15 out of 15 areas in 2024-2025. All fifteen areas met or surpassed the benchmark goal of 4.0 (80%), demonstrating strong educational effectiveness and personal growth among ATS graduates.
| GSQ. Table 14. Measure of Educational Effectiveness and Personal Growth | % |
|---|---|
| 1. Enthusiasm for learning | 90% |
| 2. Empathy for the poor and oppressed | 92% |
| 3. Insight into troubles of others | 92% |
| 4. Trust in God | 90% |
Level of Satisfaction with School’s Services and Academic Resources (2024-2025)
GSQ. Table 20. Level of Satisfaction
This table presents the Level of Satisfaction that students at Ashland Theological Seminary reported regarding school services and academic resources. In 2024–2025, 15 out of 21 areas met or exceeded the benchmark satisfaction level of 4.0 (80%). A total of thirty-one students responded to the survey.
| GSQ. Table 20. Level of Satisfaction | % |
|---|---|
| 1. Class size | 92% |
| 2. Upkeep of campus | 92% |
| 3. Quality of teaching | 90% |
| 4. Adequacy of library collection | 90% |
Overall Experience during Theological Program (2024-2025)
GSQ. Table 21. Overall Experience during Theological Program
This table shares the Overall Experience during the student’s time at Ashland Theological Seminary. All 16 out of 16 areas met or exceeded the benchmark of 4.0 (80%). There were thirty-one students who responded to the survey.
| GSQ. Table 21. Overall Experience during Theological Program | % |
|---|---|
| 1. I have grown spiritually | 96 |
| 2. My personal faith has been respected | 96 |
| 3. Faculty were supportive and understanding | 94 |
| 4. Individuals of other faith traditions have been respected | 92 |
| 5. I have been able to integrate theology & practice | 92 |
Position Expected After Graduation for All Students (2024-2025)
GSQ Table 23: Position Expected After Graduation for All Students (2024-2025)
30 students responded to this area of the GSQ.
| Position Expected After Graduation | Number of Students | % |
|---|---|---|
| Offered a position | 9 | 30.0% |
| Not offered a position | 6 | 20.0% |
| Will continue to work in current position | 12 | 40.0% |
| Personal enrichment - not looking for employment | 1 | 3.3% |
| Further study | 2 | 6.7% |
Counseling (2024-2025)
Counseling Preparation Comprehensive Examination (CPCE) (2024-2025)
MACMHC Students are required to complete a comprehensive exam near the conclusion of their program (Counselor Preparation Comprehensive Exam; CPCE); this examination is administered by an independent, national organization (the Center for Credentialing and Education; CCE). The CPCE is designed to assess core knowledge areas determined by CACREP and counselor education programs to be essential to the practice of counseling, and passing the CPCE is a program requirement for graduation. Students’ first-attempt pass rate for the 2024-2025 academic year was 96.9%; the second–attempt pass-rate was 100%.
National Counselor Exam (NCE) (2024-2025)
A student wishing to obtain an LPC license (Licensed Professional Counselor) is required to pass a national examination (National Counselor Exam; NCE); whether completed before graduation (i.e., students can receive permission to sit for this exam in their final semester of the program) or afterward, successful passage of this examination is required to practice as an LPC in Ohio. Of those sitting for the NCE in the 2024-2025 academic year, 89.2% passed the exam. The content domains evaluated on these exams correspond to the program’s learning outcomes, thus success on these standardized measures serve as useful (external) metrics of the program’s attainment of performance indicators.
CACREP Standards Assessed for Counseling Students in the MACHMC Degree (2024-2025)
Students are also assessed through examinations within each class. The minimum requirement for continuing in the academic program is a 3.0 grade point average. Students may not be eligible to continue if their grades consistently fall below a B-.
Number of Students in the MACHMC Program: 88
Number of students graduating from MACMHC: 31
Degree Completion Rate for MACMHC: 80%
Counseling Preparation Comprehensive Exam (CPCE) Pass Rate: First Attempt: 96.9%; Second Attempt: 100%
National Counselor Exam (NCE) Pass Rate: 89.2%
CACREP Standards Assessed for Counseling Students in MACMHC Degree (2024-2025)
|
Program / Department Student Learning Outcome Identifier |
ILO Identifier (I,E,C,G) |
Results |
Overall Appraisal “Exceeded” “Met” “Did Not Meet” |
Discuss to what extent the students (as a group) met the program/department SLO. |
|---|---|---|---|---|
| KO1 | I | 95.0% | Exceeded | Students Exceeded this SLO |
| KO2 | I | 100% | Exceeded | Students Exceeded this SLO |
| KO3 | G | 98.5% | Exceeded | Students Exceeded this SLO |
| KO4 | C | 99.0% | Exceeded | Students Exceeded this SLO |
| KO5 | G | 95.0% | Exceeded | Students Exceeded this SLO |
| KO6 | G | 91.7% | Exceeded | Students Exceeded this SLO |
| KO7 | G | 91.5% | Exceeded | Students Exceeded this SLO |
| KO8 | I | 100% | Exceeded | Students Exceeded this SLO |
| KO9 | E | 95.7% | Exceeded | Students Exceeded this SLO |
| PSO1 | E | 97.6% | Exceeded | Students Exceeded this SLO |
| PSO2 | C | 95.7% | Exceeded | Students Exceeded this SLO |
| PSO3 | E | 98.4% | Exceeded | Students Exceeded this SLO |
| PSO4 | G | 93.0% | Exceeded | Students Exceeded this SLO |
| PSO5 | C | 96.0% | Met | Students Exceeded this SLO |
| PSO6 | I | 92.5% | Met | Students Exceeded this SLO |
| PAO1 | E | 98.5% | Met | Students Exceeded this SLO |
Doctor of Ministry (2024-2025)
Dissertation Approved at Defense: 90.9% of candidates passed defense, which includes an oral and written report. Using the assessment rubric for the written document, 10 out of 11 students in the process passed the defense process for the year. The benchmark standard is 80%, and the program meets the standard.